3 Core languages for environmental data science
You have data from a recent field expedition or experiment, or perhaps have accessed online data from an ecological network such as NEON. As described in the Chapter 2, this is half the battle. You are now ready to start cleaning and wrangling your data, exploring your data through visualization, and conducting statistical tests. One step preceding all this work is choosing a computational toolset to enable these analyses. .
This chapter provides background on three of the most common programming languages for data science. Borrowing language from ecology, we define an environment for data science as an interconnected computational system with a particular programming language as the foundation. Just like natural environments, environments for data science differ depending on the programming language. Let’s begin.
3.1 Choosing different languages
We primarily define an environment for data science as a particular programming language and the set of additional packages (collections of functions) and software applications that go along with it. Examples of programming languages frequently used for data science include R, Python, and Julia (each briefly described in Table 3.1). However, choosing a language is just one part of acclimating to your new programming environment – there are also additional considerations related to supplementary packages, supporting software development applications (e.g. RStudio, Positron, Visual Studio Code), and frameworks for programming (including software like Rmarkdown and Quarto documents, Jupyter Notebooks, etc). We will focus more on the frameworks for programming later in Chapter 21.
| Name | First Available | Description | Reference |
|---|---|---|---|
| R | 1993 | Started as a statistical programming language. Contributed packages allow for the extension of the base language into other data science areas. | https://www.r-project.org/ |
| Python | 1991 | Started as a language meant to be flexible and easy to learn. Similar to R, contributed modules extend the core Python language to machine learning, data visualization, and other areas of science, engineering, and mathematics. | https://www.python.org/ |
| Julia | 2012 | Created with the goal of combining speed and parallel language operation, essentially taking the best aspects of different programming languages and combining into one (Bezanson et al. 2012). | https://julialang.org/ |
As data scientists, we are lucky to have the variety of these programming languages! While one programming language or another may be a better fit for a particular data task, the languages mentioned above are all broadly capable. While it may be tempting to try to learn multiple languages at once, there are advantages of developing depth of experience in a single language. After you’ve developed some depth in one language, you’ll find that many of the concepts are shared across languages, even if the syntax differs (see Chapter 13 for examples when wrangling data).
This book takes a neutral approach on which language makes the most sense for you (although admittedly both of us have our favoRites). Throughout this chapter, we’ve included a list of resources that you may find useful in developing your programming language skills. As such, we do recommend that once you’ve identified the language that makes the most sense for your needs you avail yourself from some of the resources in the Where to Begin section in ?sec-conclusion to dive deeper.
So which language should you choose? R is great for statistics, data manipulation, and data visualization. R has a strong user base in the disciplines of ecology (Lai et al. 2019) and environmental science. Additionally, the tidyverse –– a set of related packages for data science with so-called ‘tidy data’ have made R more powerful and easier to work with (Wickham 2014; Wickham and Grolemund 2017; Wickham et al. 2019).
One of the other benefits of using R is that the set of functions loaded by default (a.k.a. base R) include functions to load data files and make plots. Python and Julia each require additional packages to be loaded to easily read in data from a csv file and make a scatter plot.
Let’s see how this plays out using the example weather data from Chapter 2, which we call msp_2023. You can find this dataset as a csv file in the eds-text-data github repository. Here we will assume that you have (1) already downloaded the file msp_2023.csv into your workspace and (2) installed R, Python, and Julia to your local computer.
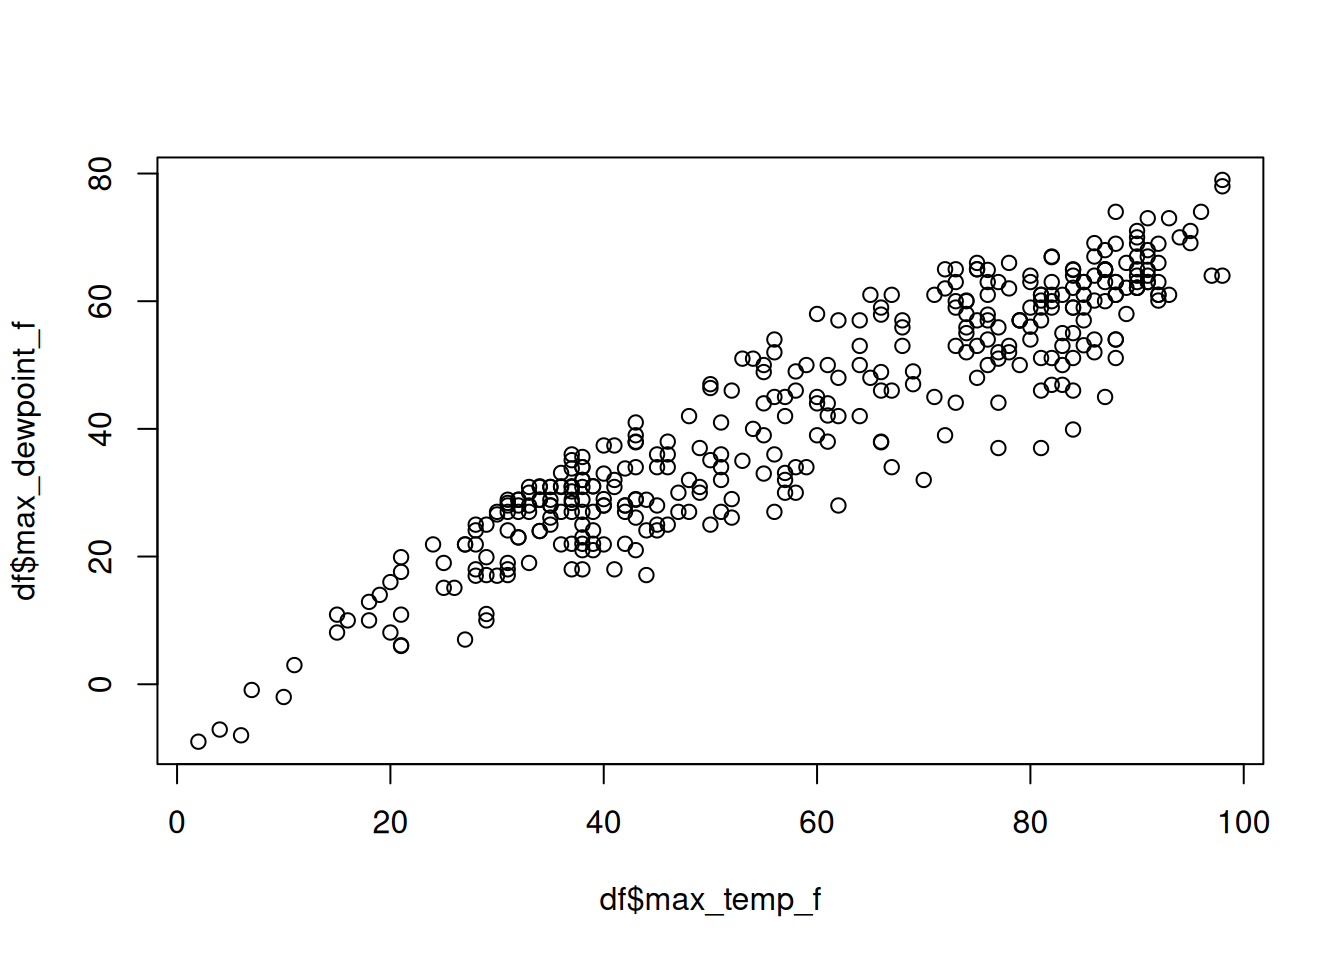
First let’s produce this plot in base R (Figure 3.1):
df <- read.csv("msp_2023.csv")
plot(df$max_temp_f, df$max_dewpoint_f)
While there can be benefits to loading as few additional packages as possible (fewer parts means fewer things to break as code changes occur into the future), most folks using R these days rely on the tidyverse set of packages for data analysis. Figure 3.2 displays a more idiomatic tidyverse way to load the data and make a simple scatterplot.
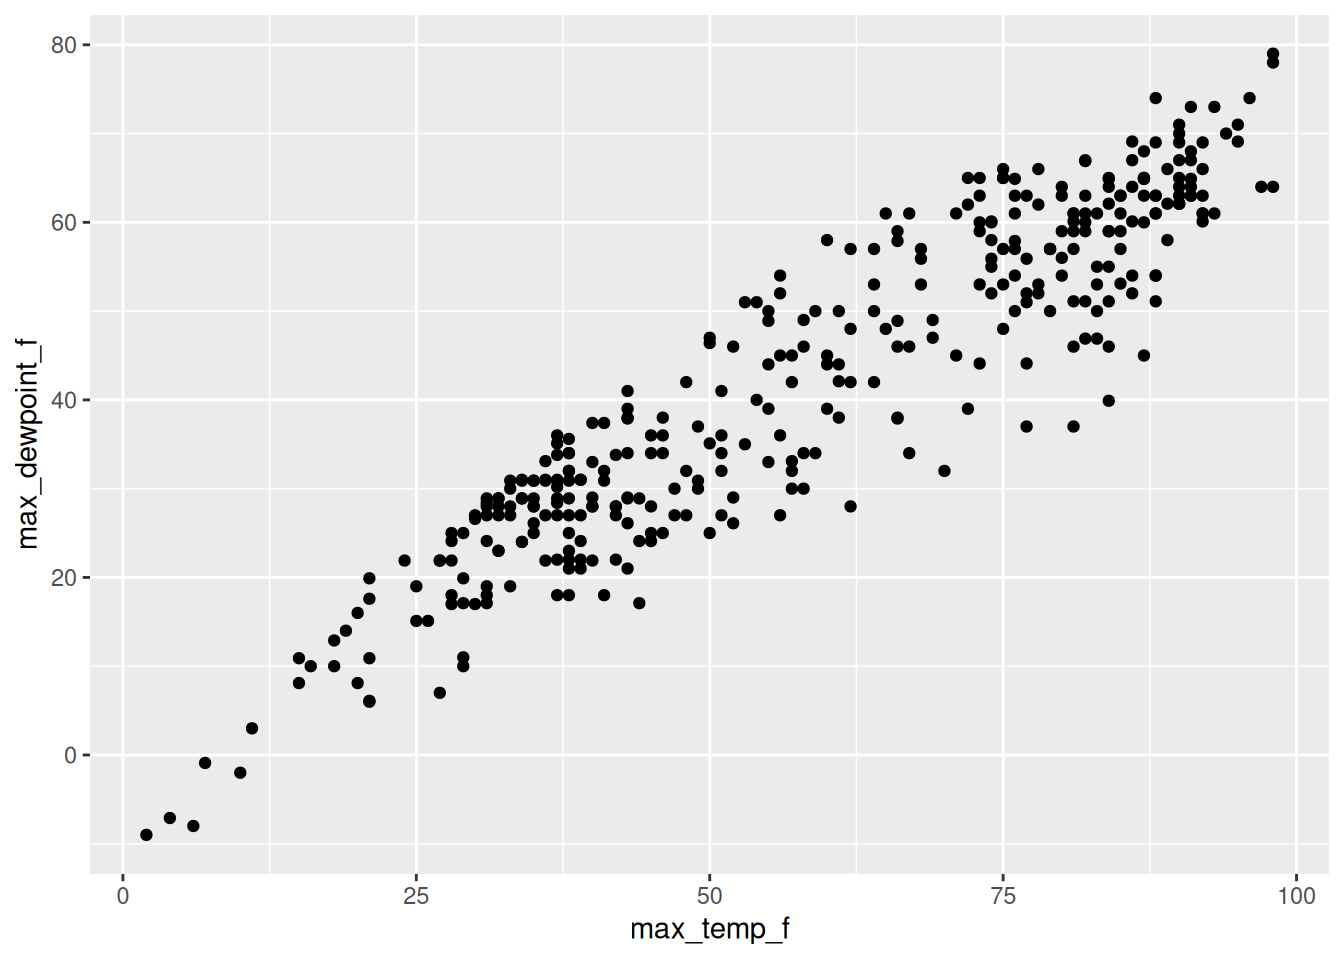
library("readr")
library("ggplot2")

read_csv("msp_2023.csv") |>
  ggplot(aes(max_temp_f, max_dewpoint_f)) +
  geom_point()
The same thing is true for Python – which at its core is a general purpose programming language (R was initially designed for statistical analysis which has morphed into wider applications for data science). Tht means Python has fewer data science specific tools out of the box. However, there is an excellent set of packages available that add this functionality; packages such as pandas, numpy, polars, and matplotlib are widely used in many data science workflows. While R has Lisp and Fortran in it’s heritage, Python draws from C and an earlier language meant for teaching programming to beginner called ABC. This is one of the reasons why Python may feel more familiar to you if you are familiar with C or C++. Python also has core strengths in machine learning with widely-used packages like TensorFlow, PyTorch, and Keras.
Figure 3.3 shows an example of Python scripts that loads the csv file and generates the plot.
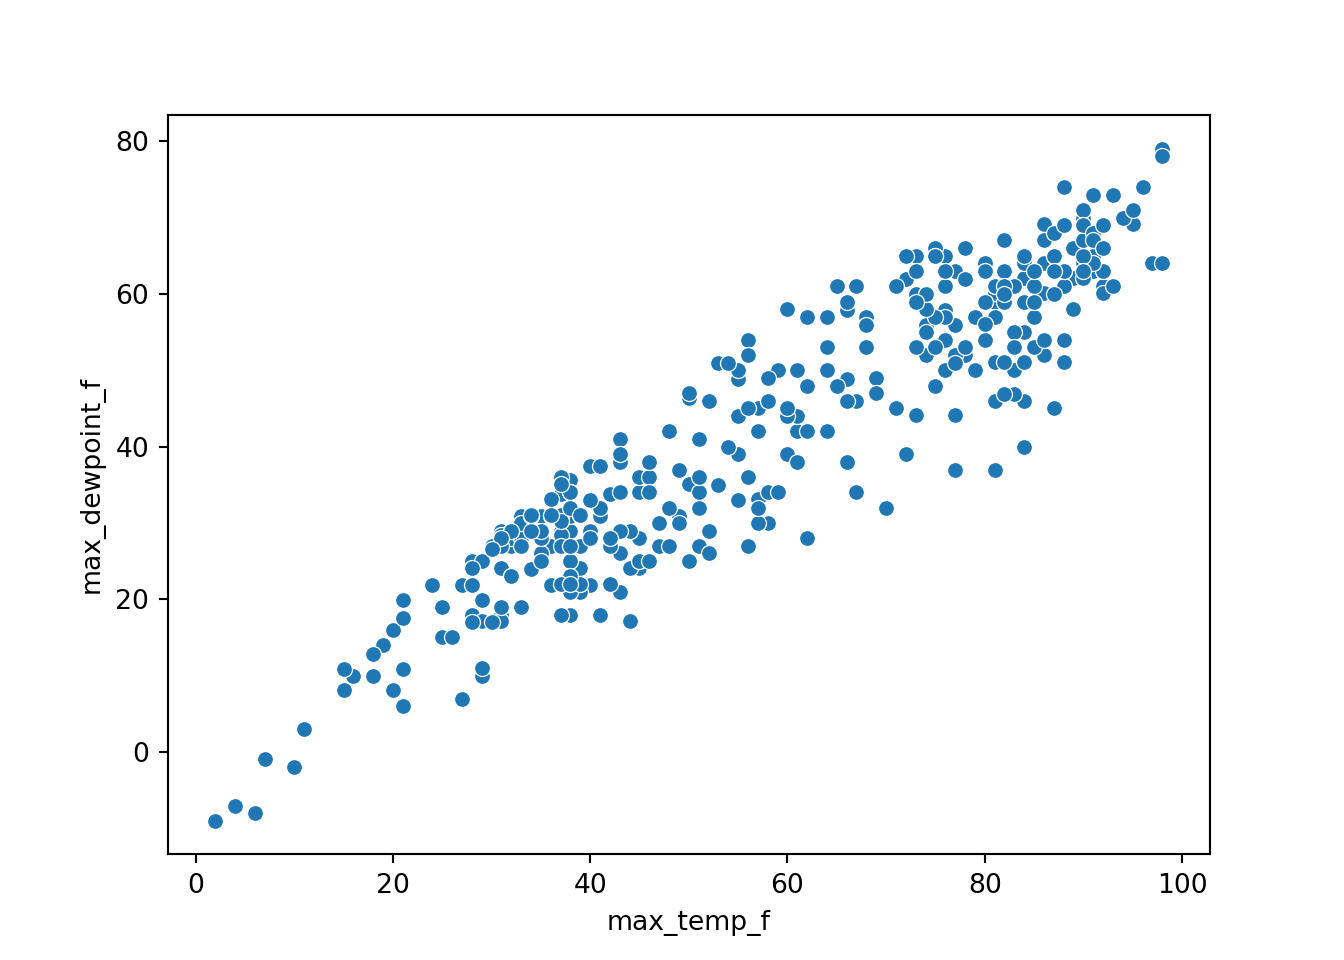
import pandas as pd
import seaborn as sns

df = pd.read_csv("msp_2023.csv")
sns.scatterplot(data=df, x="max_temp_f", y="max_dewpoint_f")
Finally, Julia is a very promising language with a user base growing in biology (Roesch et al. 2023). It may be a good choice if you have computational needs that would benefit from a language that brings together usability and speed. Julia puts together the convenience of a intentionally designed scripting language with powerful conceptual tools built in (advanced features like powerful macros and metaprogramming abilities) with the execution speed of a compiled language. We believe there is longevity in this purpose-built data science language, although it currently has a smaller user community in the environmental sciences. Notice how the Julia code to produce this plot (Figure 3.4) is very similar to the previous examples, albeit with different functions to produce the plot.
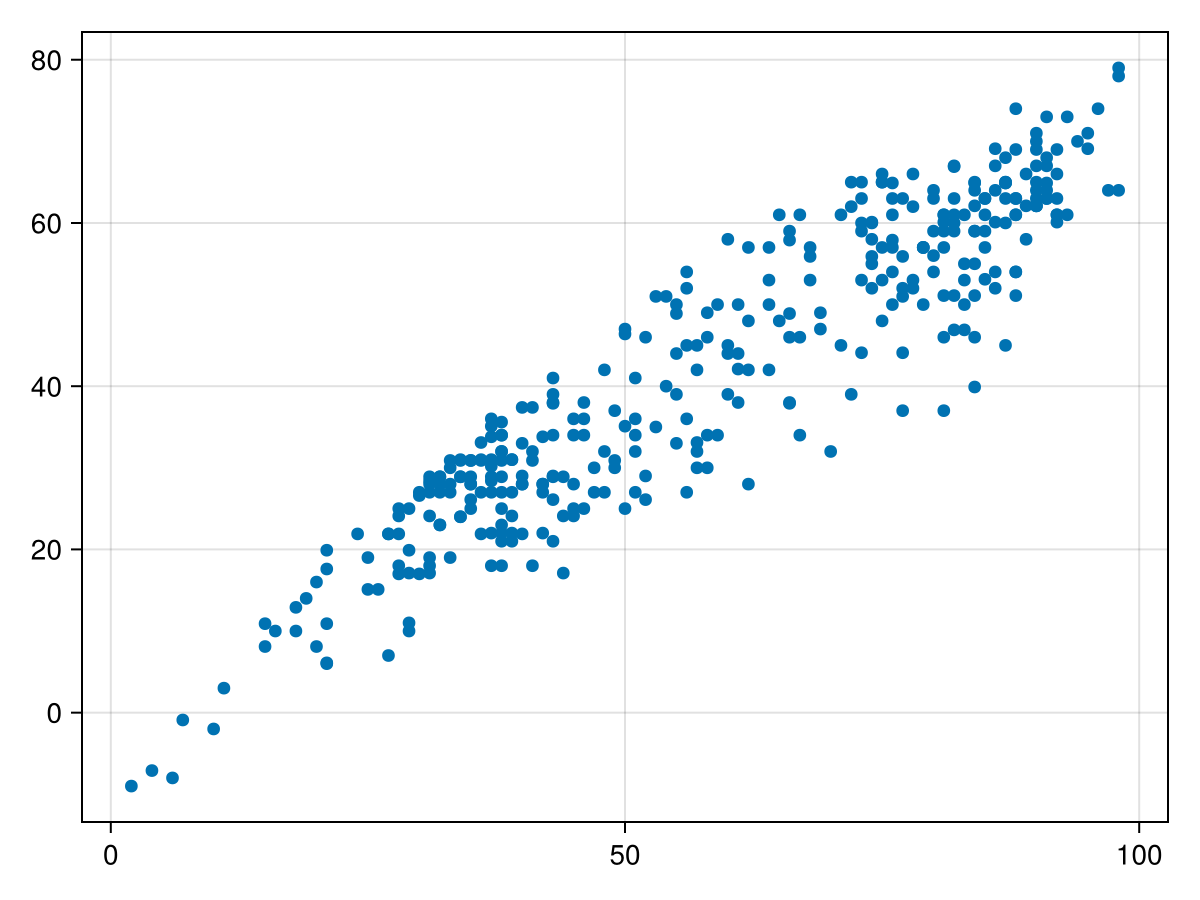
using CSV, DataFrames, CairoMakie

df = CSV.read("msp_2023.csv", DataFrame)
scatter(df.max_temp_f, df.max_dewpoint_f)
A commercial alternative to the languages mentioned above is MATLAB. This powerful software is widely used in engineering and industrial applications. However, because it is a commercial and proprietary language, it is not as translatable for open science applications. Many academic institutions have licenses, but if you are not part of an organization that already makes use of it, the cost can be prohibitive. Octave is an open-source analogue to MATLAB, but perhaps doesn’t have as large of a user base in the environmental sciences.
3.2 Our recommendations
Perhaps the most important consideration when choosing a primary programming language to invest your time learning is what your most frequent collaborators and disciplinary colleagues use. It is rare for computational scientists to work alone, and so having a shared lingua franca can be really important. Unless you have a good reason to choose otherwise, you are unlikely to go astray learning R if your primary research is in ecology or the allied environmental sciences since it’s the most popular language in use in this area (Gao et al. 2025). That said, we hesitate to paint environmental sciences with overly broad strokes. There are certain environmental subdisciplines that might make more heavy use of Python (remote sensing, for example). We offer the following reasons to help you decide on a particular language:
Reasons to choose R for a primary scripting language for a project
- Widely used and so there is a high likelihood that collaborators will also be familiar with R
- Graphical packages (e.g. ggplot2) are very strong and well integrated with other tidyverse packages
- Cutting-edge statistical methods often happen first in R (this makes sense because R was originally written by statisticians)
Reasons to choose Python for a primary scripting language for a project
- Numerous cutting-edge machine learning packages
- Integration with ArcGIS/QGIS software for explicitly spatial analyses
- Widely used outside of scientific community (and so can be a particularly valuable skill when on the broader job market)
Reasons to choose Julia for a primary scripting language for a project
- Fast, which means it may be a good choice for theoretical simulations or other computationally intensive analyses
- Intentionally designed as a language for modern data science
We believe that the best position to take is one of openness to learning new tools and software as your needs will invariably evolve. It is okay to dabble!
We will share provide some perspective on our learning paths. John swears he learned to read by typing BASIC programs that were listed at the back of the Compute magazine. In his last year of University he took a course in Java. In graduate school he used primarily MATLAB, and dabbled with R. Starting in his academic position, he transitioned to Octave because it was open-source. During his first sabbatical he then moved to work with R as a fresh start to learn new tools and techniques for managing data, especially as the tidyverse and associated tools for data science were coming into popular use.
Naupaka learned BASIC as a kid, C++ in high school, then didn’t program much until grad school, where he learned perl in a genomics course. When he started analyzing his own microbial ecology data for his PhD dissertation, he needed the community ecology statistical tools available in R so started teaching himself. Then as needs developed he also taught himself SQL, bash, Python, and a little bit of lisp.
3.3 The future: why choose?
Our experiences with programming languages reflect the timeline of when we developed as scientists and the timelines of growth of different languages. While we can’t predict the future, but we can safely say at some point you may use a programming language not even mentioned here. Our graduate school advisors programmed in C, Fortran, and SAS. While these are all still in use, we probably wouldn’t recommend any of these to our students as a first programming language. Organisms in a biological environment adapt and evolve – and so will you.
Another important trend in recent years are programming environments and workflows that offer strong support for multiple languages. Siloing yourself in an particular programming language is becoming less common with the proliferation of polyglot tools such as quarto and Jupyter notebooks. We recognize that code switching can be challenge (contributors 2021), but an important thing to keep in mind, especially as a beginner, is that once you develop strength in one programming language, it’s much easier to learn additional languages. The best environments for data science shares a common theme: they are built to support your success and longevity.
3.4 Exercises
Make an inventory of programming languages you have used over the years. Which ones do you see yourself using long-term.
Interview a mentor or your advisor about what programming languages they used, and what they would recommend.
The dataset
msp_2023can be found in the eds-text-data github repository, and as a comma separated value (csv) file.- Using a programming language you are familiar with, download this file (or import it directly) into a programming language. Make a simple plot of the two of the variables in the dataset.
- Using a programming language you are not familiar with, read in the file and make the same plot as you did previously (it is ok to use AI to help you) Is the plot what you would expect?