5.1 Equilibrium solutions
A great place to start is where the rate of change for a differential equation is zero, or in other words there is no flow. Borrowing ideas from calculus, this occurs when the rate of change is zero. We solve this by setting the left hand side of \(\displaystyle \frac{dy}{dt}=f(y)\) equal to zero and solving for \(y\) (or whatever dependent variable describes the problem).
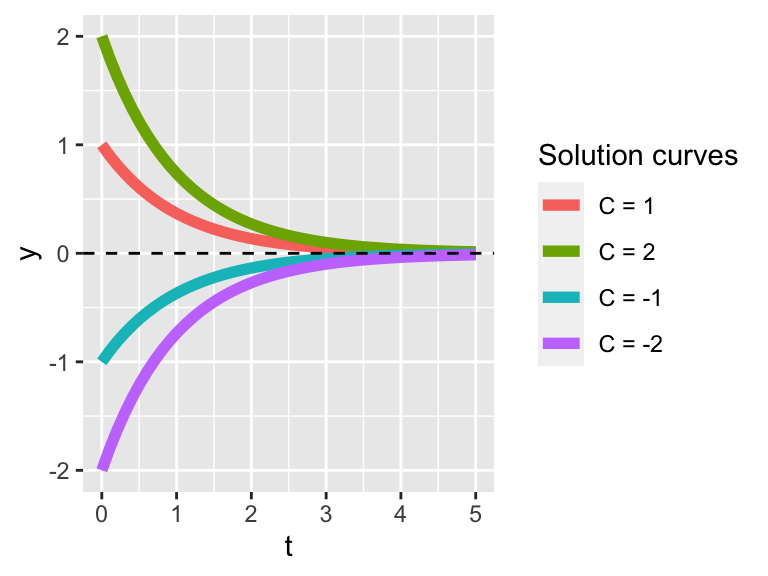
The general solution to the differential equation \(\displaystyle \frac{dy}{dt}=- y\) is when \(y(t)=Ce^{-t}\), where \(C\) is an arbitrary constant. Figure 5.1 plots different solution curves, with the equilibrium solution shown as a horizontal line:

Figure 5.1: Solution curves to \(y'=-y\)
Notice that as \(t\) increases, all solutions approach the equilibrium solution \(y=0\) as \(t\) no matter if the initial condition is positive or negative. A second way that we can verify that solutions approach the equilibrium solution is by evaluate the following limit: \(\displaystyle \lim_{t\rightarrow \infty} Ce^{-t} = 0\).
Solution. In this case the equilibrium solutions occur when \(N \cdot(1-N) = 0\), or when \(N=0\) or \(N=1\).
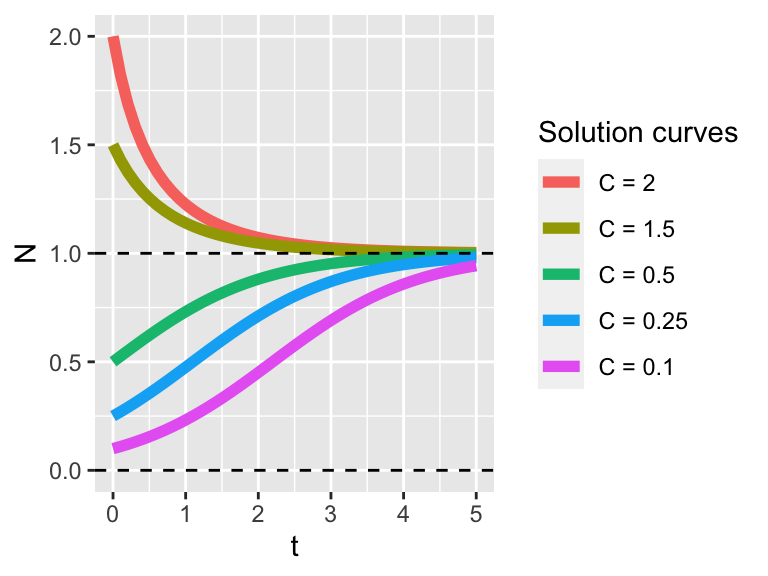
The generic solution to this differential equation is \[ \displaystyle N(t)= \frac{N_0}{N_0 +(1-N_0) e^{-t}}.\] Figure 5.2 displays several different solution curves.

Figure 5.2: Solution curves for \(N'=N(1-N)\)
In Figure 5.2 notice how all the solutions tend towards \(N=1\), but even solutions that start close to \(N=0\) seem to move away from this equilibrium solution. This example brings us to understanding classifying the stability of the equilibrium solutions.