1.6 Exercises
Exercise 1.1 Solutions to an outbreak model of the flu are the following: \[\begin{align*} \mbox{Saturating model: } & I(t) = 3000-(2990)e^{-.1t} \\ \mbox{Logistic model: } & I(t) = \frac{30000 }{10+(2990)e^{-.15t}}, \end{align*}\]
where \(t\) is in days. Use these two functions to answer the following questions:
- Plot the saturating and logistic models when \(0 \leq t \leq 100\).
- For both models, how would you describe the growth of the outbreak as \(t\) increases? How many people will be infected overall?
- Finally, for both models evaluate \(\lim_{t \rightarrow \infty} I(t)\). How do these results compare to values found on your graph?
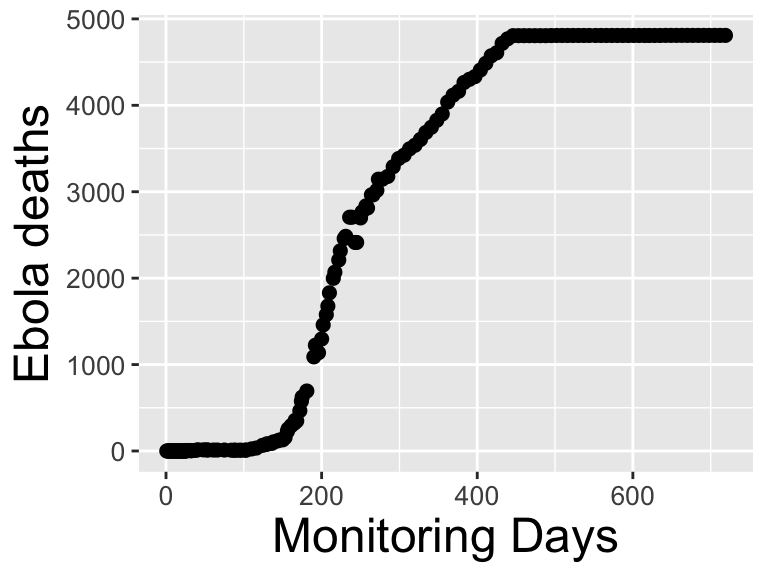
Figure 1.6: An Ebola outbreak in Liberia in 2014
Exercise 1.5 A model that describes the growth of sales of a product in response to advertising is the following: \[\frac{dS}{dt} = .55\sqrt{1-S}-S, \] where \(S\) is the product’s share of the market (scaled between 0 and 1). Use this information to answer the following questions:
- Make a plot of the function \(f(S)=.55\sqrt{1-S}-S\). for \(0 \leq S \leq 1\).
- Interpret your plot to predict when the market share will be increasing and decreasing. At what value is \(\displaystyle \frac{dS}{dt}=0\)? (This is called the steady-state value.).
- A second campaign is has the following differential equation: \[\frac{dS}{dt} = .2\sqrt{1-S}-S \]
- What is the steady-state value and how does it compare to the previous one?
Exercise 1.6 A more general form of the advertising model is
\[\begin{equation} \frac{dS}{dt} = r\sqrt{1-S}-S, \end{equation}\]
where \(S\) is the product’s share of the market (scaled between 0 and 1). The parameter \(r\) is related to the effectiveness of the advertising (between 0 and 1).
- Solve \(\displaystyle \frac{dS}{dt} = r\sqrt{1-S}-S\) for the steady state value (where \(\displaystyle \frac{dS}{dt}=0\)). Your final answer should be expressed as a function \(S(r)\).
- Make a plot of the steady state value as a function of \(r\), where \(0 \leq r \leq 1\).
- Based on your plot, what can you conclude about the steady state value as the effectiveness of the advertising increases?
Exercise 1.7 A common saying is “You are what you eat.” This saying is mostly true and can be related in a mathematical model! Here’s how: an equation that relates a consumer’s nutrient content (denoted as \(y\)) to the nutrient content of food (denoted as \(x\)) is given by: \[\begin{equation} y = c x^{1/\theta}, \end{equation}\] where \(\theta \geq 1\) and \(c\) are both constants is a constant. Units on \(x\) and \(y\) are expressed as a proportion of a given nutrient (such as nitrogen or carbon). Let’s start with an example when \(c=1\) and \(\theta = 1\). Our function then is \(y=x\). In this case the point \((0.05,0.05)\) would say that if an animal ate food that was 5% nitrogen, their body composition would be 5% as well.
- Now assume that \(c=1\). How does the nutrient content of the consumer compare to the food when \(\theta=2\)? Draw a sample curve and interpret it, contrasting it to when \(\theta = 1\).
- Now assume that \(c=1\). How does the nutrient content of the consumer compare to the food when \(\theta=5\)? Draw a sample curve and interpret it, contrasting this curve to the previous two.
- What do you think will happen when \(\theta \rightarrow \infty\)? Draw some sample curves to help illustrate your findings.
Exercise 1.10 Organisms that live in a saline environment biochemically maintain the amount of salt in their blood stream. An equation that represents the level of \(S\) in the blood is the following:
\[\frac{dS}{dt} = I + p \cdot (W - S), \]
where the parameter \(I\) represents the active uptake of salt, \(p\) is the permeability of the skin, and \(W\) is the salinity in the water. Use this information to answer the following questions:
- What is that value of \(S\) at steady state, or when \(\displaystyle \frac{dS}{dt} = 0\)? Your final answer should be a function \(S(I,p,W)\).
- Witn the steady state solution, Use your what parameters (\(I\), \(p\), or \(W\)) cause the steady state value \(S\) to increase?
Exercise 1.11 The immigration rate of bird species (species per time) from a mainland to an offshore island is \(I_{m} \cdot (1-S/P)\), where \(I_{m}\) is the maximum immigration rate, \(P\) is the size of the source pool of species on the mainland, and \(S\) is the number of species already occupying the island. Additionally the extinction rate is \(E \cdot S / P\), where \(E\) is the maximum extinction rate. The growth rate of the number of species on the island is the immigration rate minus the extinction rate.
- Make representative plots of the of the immigration and the extinction rates as a function of \(S\). You may set \(I_{m}\), \(P\), and \(E\) all equal to 1.
- Determine the number of species for which the net growth rate is zero, or the number of species is in equilibrium. Express your answer as \(S\) as a function of \(I_{m}\), \(P\), and \(E\).
- Suppose that two islands of the same size are at different distances from the mainland. Birds arrive from the source pool and they have the same extinction rate on each island. However the maximum immigration rate is larger for the island farther away. Which of the two islands will have the larger number of species at equilibrium?
Exercise 1.12 This problem relates to animal size and volume. Assume that an animal assimilates nutrients at a rate \(R\) proportional to its surface area. Also assume that it uses nutrients at a rate proportional to its volume. You may assume that the size of the animal is implicitly a function of the nutrient intake and usage. Determine the size of the animal if its intake and use rates were in balance (meaning \(R\) is set to zero), assuming the animal is the following shapes:
- A sphere (assume size is measured with radius \(r\)) Note: first determine the geometric formulas for surface area and volume.
- A cube (assume size is measured with length \(l\))