12.1 Estimating the growth of a dog
The problem we are considering is fitting the following data to a logistic model, adapted from here. We initially plotted these data in Section 2, but here is the code again.
wilson_data_plot <- ggplot(data = wilson) +
  geom_point(aes(x = days, y = mass)) +
  labs(
    x = "Days since birth",
    y = "Weight (pounds)"
  )

wilson_data_plot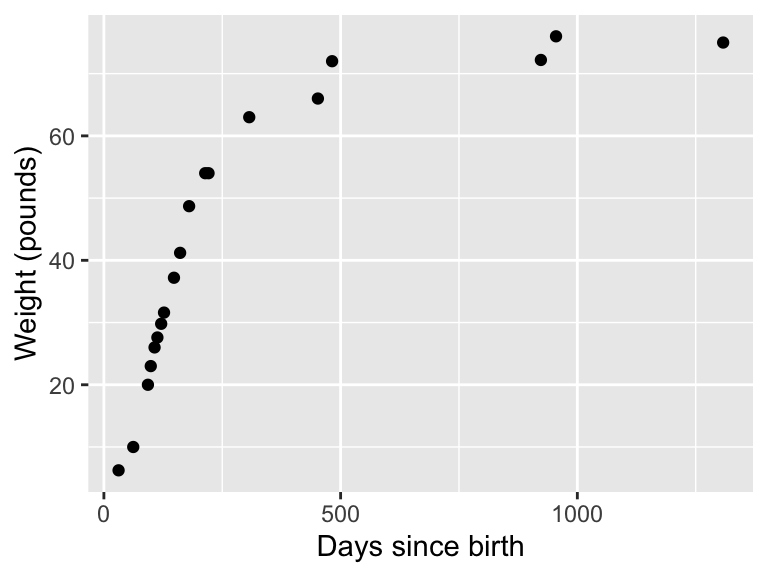
Figure 12.1: Weight of the dog Wilson over time.
Notice that for Figure 12.1 we stored the plot in the variable wilson_data_plot. We will be using this plot several times here, so storing it will help us save some typing.
The function we wish to fit from the data is the following \[\begin{equation} W =f(D,p_{1})= \frac{p_{1}}{1+e^{(p_{2}-p_{3}D)}}, \end{equation}\] where we have the parameters \(p_{1}\), \(p_{2}\), and \(p_{3}\). Notice how \(W\) is a function of \(D\) and \(p_{1}\). For convenience we will set \(p_{2}= 2.461935\) and \(p_{3} = 0.017032\). Now we are only estimating the parameter \(p_{1}\) which represents the maximum possible weight of the dog.
Let’s take an initial guess for the parameter \(p_{1}\). You may recognize that \(p_{1}\) is the horizontal asymptote of this the function \(W\). So at first glance let’s set \(p_{1}=78\). Let’s plot that result along with the data:
days <- seq(0, 1500, by = 1)

p1 <- 78
p2 <- 2.461935
p3 <- 0.017032
mass <- p1 / (1 + exp(p2 - p3 * days))

my_guess <- tibble(days, mass)

my_guess_plot <- wilson_data_plot +
  geom_line(data = my_guess, color = "red", aes(x = days, y = mass))

my_guess_plot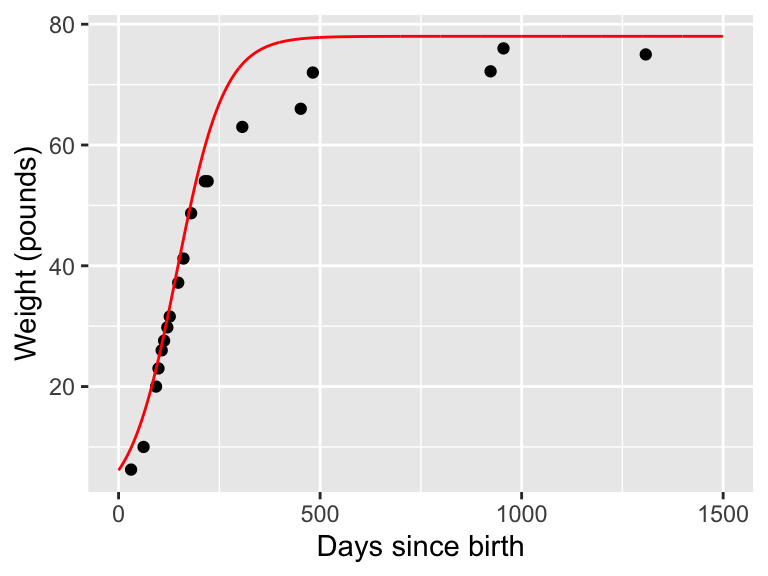
Figure 12.2: Weight of the dog Wilson with initial guess \(p_{1}=78\).
As we did with Figure 12.1, we are going to store the updated plot as a variable. It seems that this value of \(p_{1}\) does a good job capturing the initial rate of growth initially but perhaps predicts too high of a mass towards the end.
For comparison let’s also examine the plot of the data when \(p_{1}=65\):
days <- seq(0, 1500, by = 1)

p1 <- 65
p2 <- 2.461935
p3 <- 0.017032

mass <- p1 / (1 + exp(p2 - p3 * days))

my_guess_two <- tibble(days, mass)

my_guess_plot +
  geom_line(data = my_guess_two, color = "blue", aes(x = days, y = mass))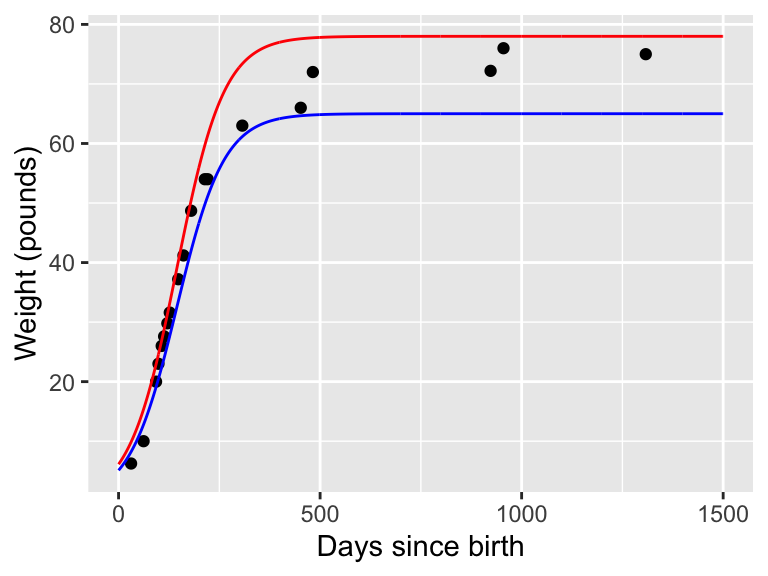
Figure 12.3: Weight of the dog Wilson with initial guess \(p_{1}=78\) (red) and \(p_{1}=65\) (blue).