23.2 More realizatons
Similar to section on stochastic simulation, One thing that would be helpful is if we ran the simulation for multiple times, or multiple realizations. The code random_walk can help us do that:
number_steps <- 200 # How long we run our random walk
number_realizations <- 20 # How many separate realizations we do

random_walk(number_steps, number_realizations)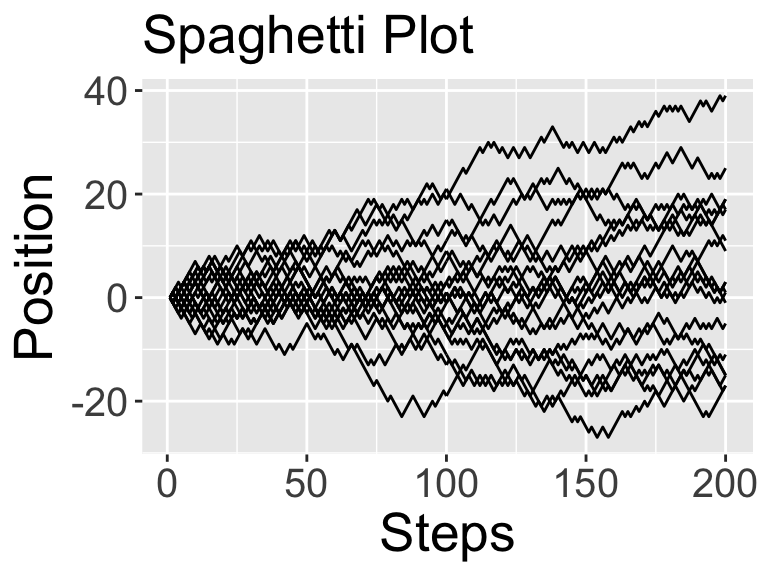
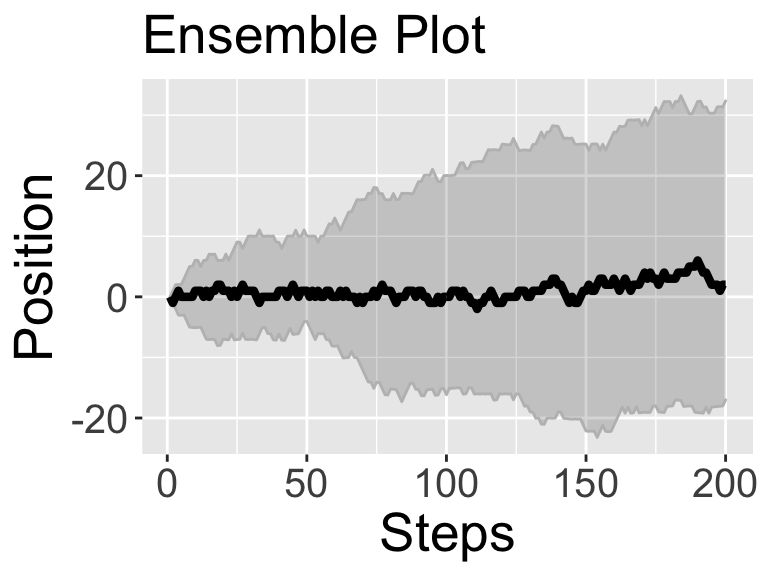
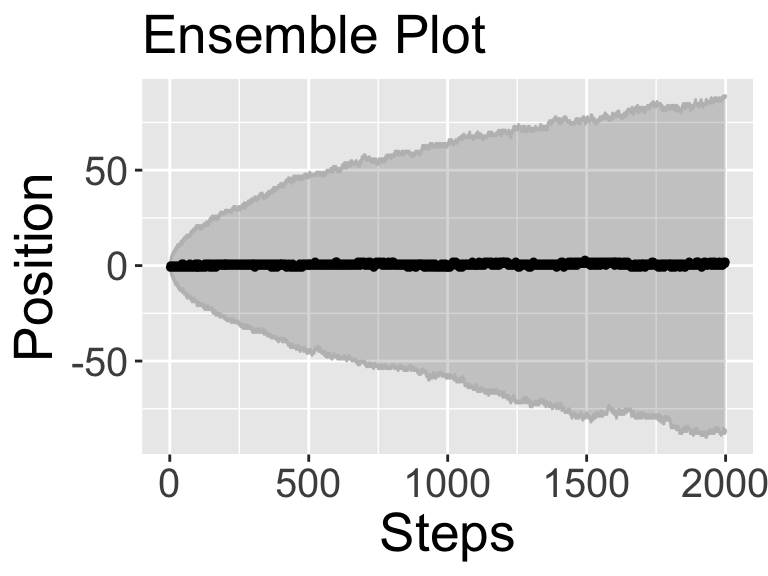
You will notice two plots get produced: (1) A spaghetti plot that plots all the different sample paths for this realization, and (2) a ensemble plot that takes the median and 95% confidence interval of the results. (While we learned how to visualize spaghetti plots and compute ensemble averages in the Section 22, for ease of use this code does it all in one.)
Something interesting looks like it is going on here. The ensemble plot looks like a sideways parabola, but let’s check to make sure that is the case. Perhaps rerun random_walk but set number_realizations to be 100:
number_steps <- 200
number_realizations <- 100

random_walk(number_steps, number_realizations)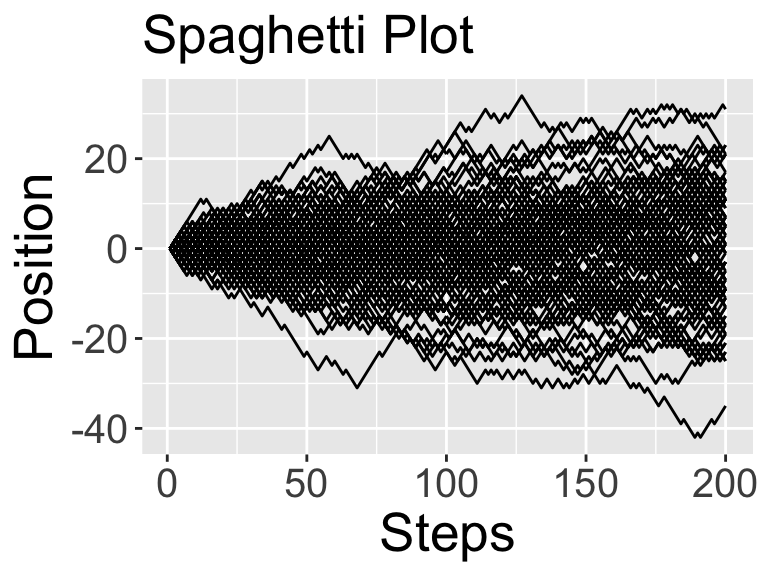
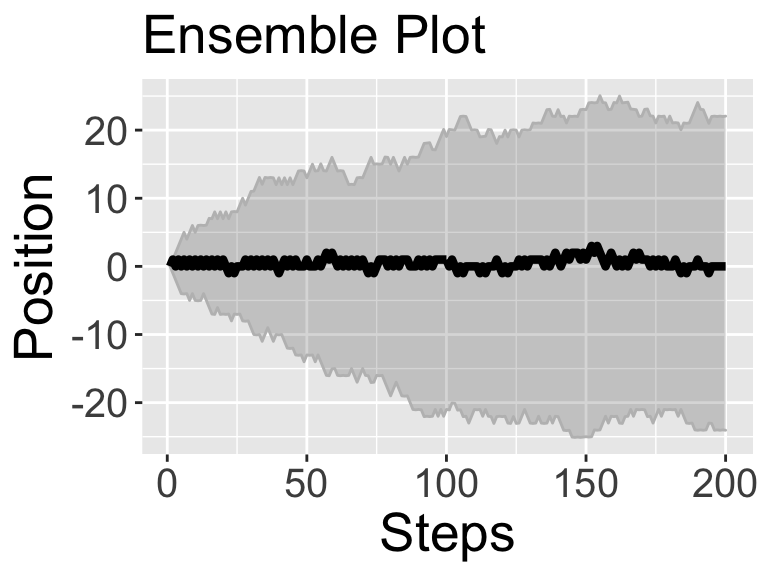
As the confidence interval increases as the number of steps increase, we get an interesting observation. These results suggest that on average you go nowhere (in other words, the average position is \(x=0\)), but as the number of steps increase, you are very likely to be somewhere (in other words, the confidence interval increases as the number of steps increase). The more realizations we can do the more robust this pattern becomes. Consider what occurs to the spaghetti and ensemble plots when the number of realizations is 1000:
random_walk(2000, 1000)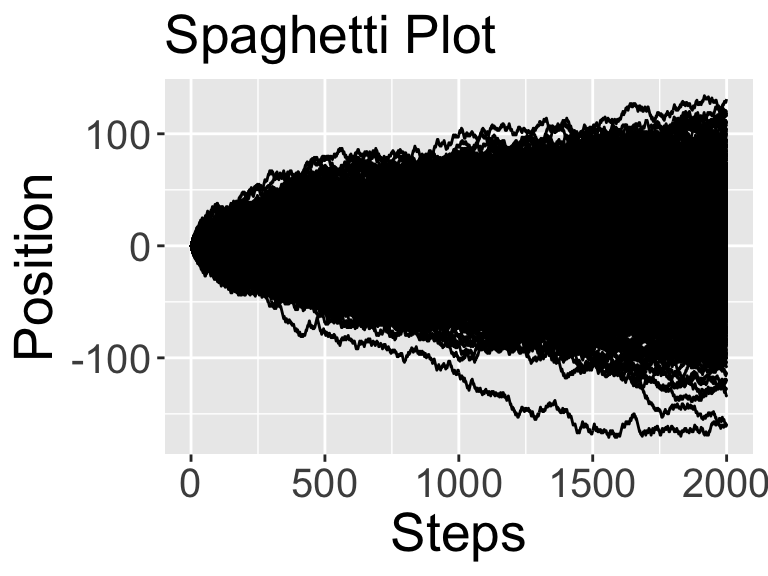
Let’s investigate our observations a little more mathematically.